There are hundreds of metrics within Facebook Ads, but which are the most important ones that you must keep your eyes on? In this post, we will share 5 Facebook Ads metrics that you should look at every time you log in to your Ads Manager. Like the 80/20 or Pareto principle, not every metric within the dashboard is important, nor will you ever use them.
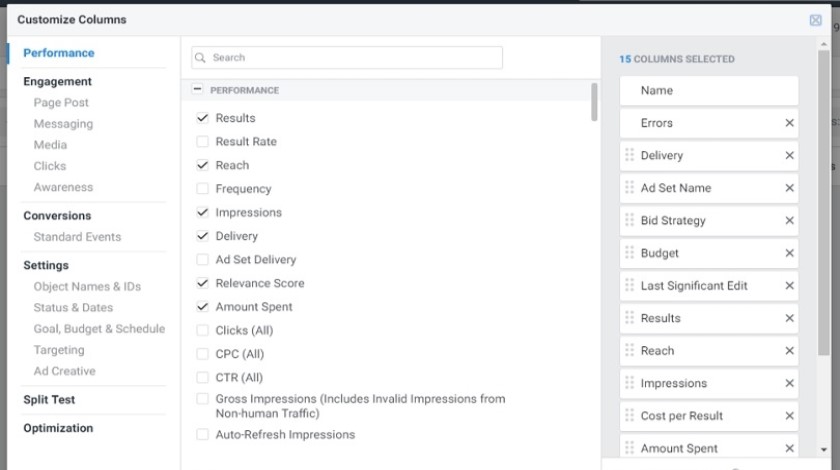
You will find all these metrics in your Ads Manager dashboard. Under Columns, you will see that there are a lot of preset columns to choose from, saving you time and effort. Depending on what’s important to you, you may want to filter to the relevant columns. For example, the Video Engagement column will show you how well your videos perform on Facebook. and the Engagement column will show you how well your posts are doing in terms of likes, comments, and shares.
Think of the Columns section as different sides of a cube, providing you with quick insights into your campaigns. But as you can see, Facebook has set the Performance column to default, and it will always open up first when you load up your Ads Manager. And that is good; at the end of the day, aren’t we all performance advertisers?
1. Results
Results are the total number of times your campaign received its desired outcome.
This is arguably the most important metric of every campaign and will vary based on the type of campaign and the goal you have set.
Results will typically be a conversion metric, such as website purchases or leads. However, if you’re running a brand awareness campaign, you may have traffic or impressions as your target result.
2. Cost Per Result
Cost per Result measures how much each desired result (or action) costs. While the first metric lets you know how well your campaigns have done, the Cost per Result metric will let you know how much have you spent to acquire the result. This is commonly known as CPA (Cost per Acquisition) on other platforms such as Google Ads. This metric tells you if you have overpaid for the results.
The formula for this metric is total ad spend / number of results.
For example, you may spend $1,000 to gain 10 leads. The Cost per Result of each lead will be $100. Now if you are a car dealership getting users to sign up for a test drive, this may make sense. But if you are an HVAC company and your average service value is $80, then you are losing money on the initial sale.
The Results metrics need to be used together with Cost per Result so you can see the full picture.
3. ROAS (Return on Ad Spend)
ROAS (Return on Ad Spend) is the revenue the company receives for every $1 invested in ads. Say you invested $1,000 in Facebook Ads which brought you $3,500 in sales, and now you have a 3.5 ROAS. This also means that for every $1 invested, you got $3.50 in revenue.
ROAS is one of the most telling metrics to understand if you have a successful Facebook Ads campaign. This is useful for eCommerce businesses, where many products have different margins, looking at the ROAS metric will be more relevant than a CPA metric, such as Cost per Result.
The formula to calculate ROAS is Revenue / Ad Spend.
4. CPM (or CPC)
CPM (Cost per Mille) is the cost to achieve 1000 impressions. This is a helpful metric to help you understand how much you are paying on average to show your ads. Some industries may have higher CPMs than others. If you are paying per click, you will look at your Cost per Click or CPC instead.
CPM is a standard metric across online advertising. It measures the cost-effectiveness of an ad campaign. Use this metric to compare costs across different ad publishers and campaigns.
High CPMs are a common cause of high Cost per Result or low Return on Ad Spend, so knowing your numbers will help you decide on the best steps to take on your account.
5. Impressions
Impressions are the number of times your ads were shown on the user’s screen. Most of the time, this metric will not cause you to take action, but it is still good to see how much exposure your ads have gotten. Is the number satisfactory or is it too low?
Generally, the more impressions your ad receives, the higher your brand awareness. This is because more people are exposed to your ad. Though 1 person may see your ads multiple times, so use the Reach metric alongside your Impressions metric. While impressions are the total number of times your ad has been seen, reach is the total number of unique people who have seen your ad.
If you are using brand awareness campaigns, this will be your primary metric.
Summary
Monitoring the performance of each of your Facebook Ad campaigns can be time-consuming if you do not know what you are looking at. However, by focusing on these 5 metrics, you can slowly build up your Facebook Ads repertoire in no time.


